

Bitcoin price may be trading sideways, but it continues to hold above a key level that in the past led to over 5,000% returns. BTCUSD has now held for its seventh consecutive weekly close above the Ichimoku cloud, but there’s a shocking twist coming that could shake up the sideways trend.
Bitcoin Price Closes Seventh Weekly Candle Above Ichimoku Cloud
The leading cryptocurrency by market cap has been consolidating below resistance for months now, preparing for its next major move. A rejection could potentially expose Bitcoin price to setting a new lower low, but a breakout above the current level could kick off a new bull market.
Because of the possible implications of the tight trading range breaking, crypto analysts are scouring through price charts hoping to make sense of the confusing price action.
Related Reading | This Unique Perspective on Bitcoin Charting Makes Bull Breakout Clear As Day
Some charting perspectives indicate a clear breakout and retest already, while other takes hint at something more bearish ahead.
Analysts are also relying on technical analysis indicators to help shed light on what to expect, and even that is cloudy. Bollinger Bands show the tightest contraction in years, something that typically precedes an over 50% or more movement. Weekly MACD is still bullish, as are other key indicators.
On the Ichimoku indicator, the market’s top crypto asset has been holding above the Kumo, or “cloud.” Bitcoin price candles have now closed above the Kumo for seven consecutive weeks. But what exactly does this mean or suggest?

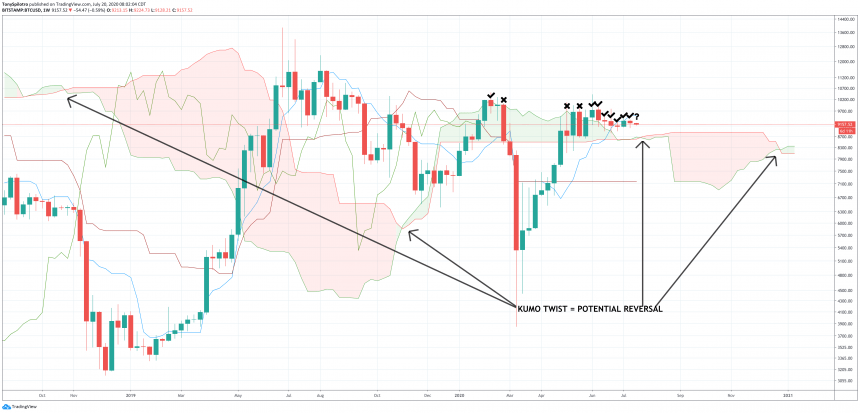

BTCUSD Weekly Ichimoku | Source: TradingView