
Ethereum is looking to fall towards $200 after breaking a multi-week support level this Monday.
The price floor was a part of a Bear Flag pattern. In retrospect, Bear Flag appears as an asset consolidates in an upward channel following a robust directional move down. The price eventually breaks below the Channel’s lower trendline, a move that signals extension/continuation to the existing bearish bias.
ETH/USD broke below its Bear Flag support on Monday. The pair suffered two days of selling sentiment, falling more than 6 percent as traders failed to break above a crucial technical resistance level of $375.


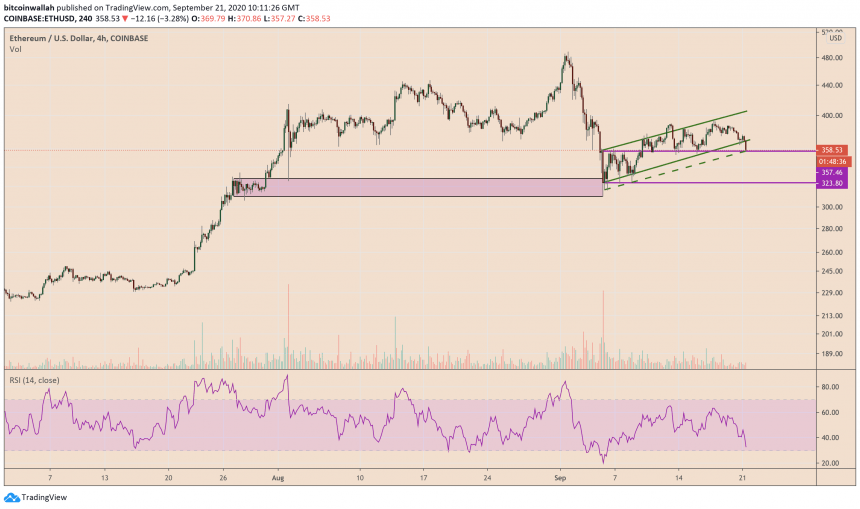
Ethereum breaks out of a Bear Flag pattern to signal further downside moves. Source: TradingView.com
ETH/USD is now testing the intermediary downside target (dashed green; $350) of the same Bear Flag for a sharp pullback. It, nevertheless, risked breaking further to the downside, with immediate short targets lurking insides the $323-310 range.

The entire bottom area between $310 and $350 served as an accumulation range for traders, according to Ethereum’s recent price behaviors. The purple bar in the chart above shows ETH/USD undergoing sharp rebounds.
<div
Related Posts

Robert Kiyosaki Says No to Spot Bitcoin ETF Investments
Robert Kiyosaki Says No to Spot Bitcoin ETF Investments Jimmy Aki Last updated: April 12, 2024 17:17 EDT | 2...

6 Best Crypto Patreon Groups to Join in 2024
6 Best Crypto Patreon Groups to Join in 2024 Connor Brooke Last updated: April 18, 2024 15:29 EDT | 11...

BlackRock ETF Closing in on Grayscale Market Share Despite Low Inflows
BlackRock ETF Closing in on Grayscale Market Share Despite Low Inflows Jimmy Aki Last updated: April 18, 2024 15:55 EDT...

Popular Analyst Plan B Predicts Bitcoin Price to Surpass $300,000 in 2025 – Here’s How
Popular Analyst Plan B Predicts Bitcoin Price to Surpass $300,000 in 2025 – Here’s How Jimmy Aki Last updated: April...

Over 27,700 BTC ($1.72 Billion) Moves into Accumulation Addresses Amidst Bitcoin’s Dip Below $63,000
Over 27,700 BTC ($1.72 Billion) Moves into Accumulation Addresses Amidst Bitcoin’s Dip Below $63,000 Hassan Shittu Last updated: April 18,...


