
Bitcoin price recently collapsed from $12,400 to under $10,000 after the cryptocurrency presented a near-perfect distribution pattern.
If the pattern continues, the market could form a massive head and shoulders top, with a price target of significantly lower.
Distribution Pattern Costs Crypto Investors An Arm And A Leg
Bitcoin price over the last several weeks had formed what by comparison appeared to be a clear distribution pattern. After the $2,000 plunge last week, that pattern may have been confirmed, now that the first-ever cryptocurrency is trading at around $10,000.
Related Reading | Bitcoin Collapse Retests Key Weekly Level Never Lost During Last Bull Run


Rather than embarking on this massive bull run, crypto investors are licking their wounds after a surprise move that was telegraphed in advance by the ominous Wyckoff distribution pattern.

On higher timeframes using Renko charts, however, the pattern still has another phase to go, before mark down begins.
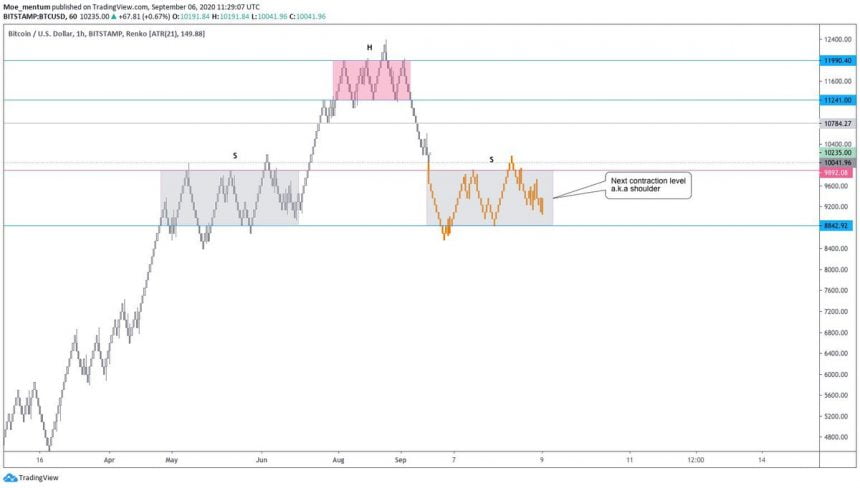
BTCUSD Renko Distribution Head and Shoulders Chart | Source: TradingView
Bitcoin Head and Shoulders Points To Another Leg Down
According to the chart above, if the current level fails to hold,
Related Posts

Bitcoin Price Prediction as BTC Bounces 10% From Recent Bottom – New Rally Starting?
Bitcoin Price Prediction as BTC Bounces 10% From Recent Bottom – New Rally Starting? Arslan Butt Last updated: April 16,...

BlackRock’s Bitcoin ETF Sees $73M in Inflows as Other Funds Remain Stagnant
BlackRock’s Bitcoin ETF Sees $73M in Inflows as Other Funds Remain Stagnant Ruholamin Haqshanas Last updated: April 16, 2024 02:12...

Reserve Bank of Fiji Says Crypto Not Recognised as Legal Tender
Reserve Bank of Fiji Says Crypto Not Recognised as Legal Tender Tanzeel Akhtar Last updated: April 16, 2024 04:33 EDT...

Bitcoin Price Prediction: BTC Drops to $62,900 as Market Eyes Upcoming Halving and ETF Approval
Bitcoin Price Prediction: BTC Drops to $62,900 as Market Eyes Upcoming Halving and ETF Approval Arslan Butt Last updated: April...

Largest U.S. Crypto ATM Firm Reports No Impact on Revenues Despite Bitcoin Price Volatility
Largest U.S. Crypto ATM Firm Reports No Impact on Revenues Despite Bitcoin Price Volatility Hassan Shittu Last updated: April 16,...


